The “worst” vehicles in the fleet
Following the configuration of the consumption categories, a section is available on the dashboard presenting the least efficient vehicles (up to 6) in the fleet in relation to their respective objectives over the selected period.
You can find the difference in relation to the consumption target set (in L/100km or L/H), the consumption category as well as the comparison with the previous month.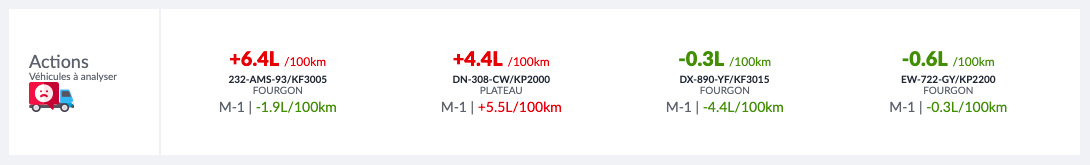
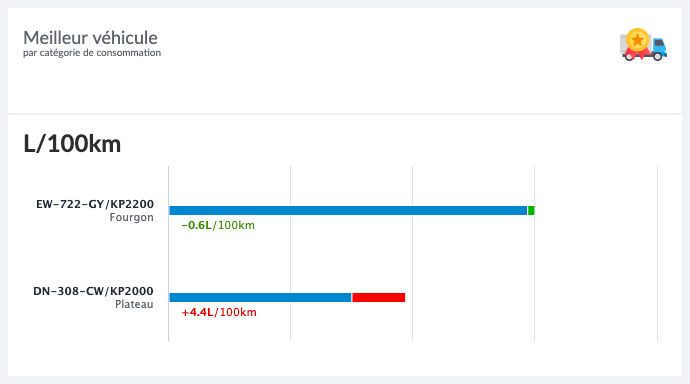
The “best” vehicles in each consumption category
Always concerning with reference to the configuration of the consumption categories, the best vehicles of each of these categories over the selected period are displayed.