Analyze a vehicle individually
The consumption calculations are carried out daily automatically at the end of the day and are therefore available the following day.
To perform the analyses, go to the individual vehicle statistics page from the vehicle list by clicking on the following icon , or from the information window.
All individual statistics for the selected vehicle are accessible from this screen. As on the dashboard, the data presented are:
- Overall consumption
+ link to the consumption graph in real time - Distance traveled over the period
- Working time and TCA
+ access link to the details of all the consumptions at the stop and their positioning - Average consumption
- Reminder of the consumption target
- Consumption category reminder
- Average of vehicles in this category
- Daily distribution
+ possibility to remove a day of consumption data in the event of an anomaly
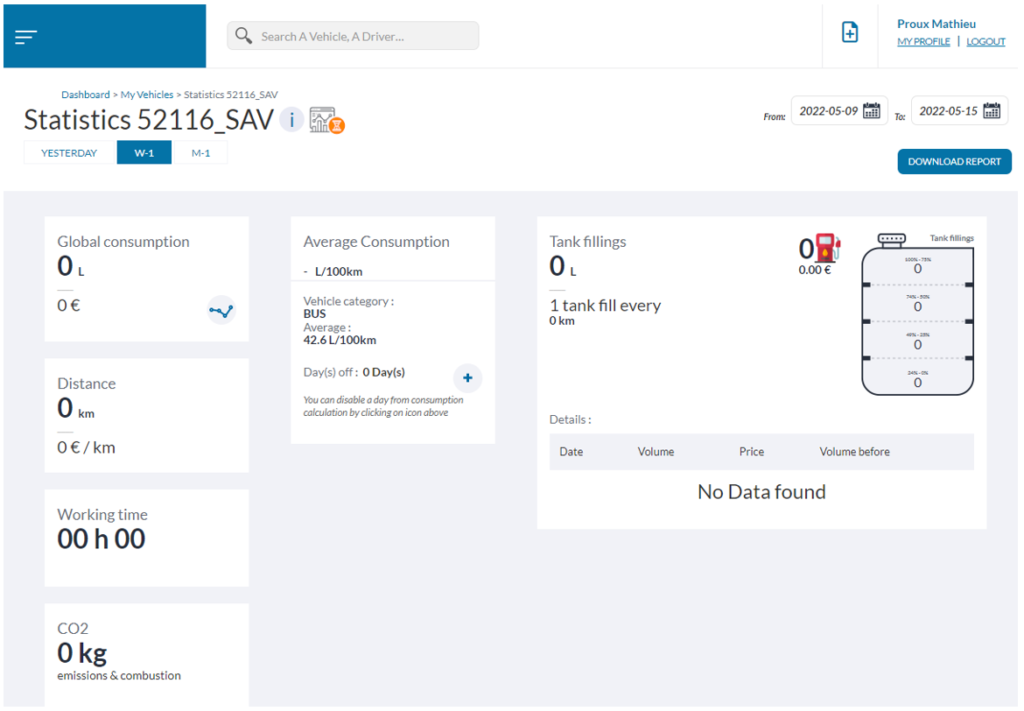
To configure this view, it is possible to select predefined periods on the left: Yesterday , W-1 the previous week or M-1 the previous month. Personalized dates are accessible on the right of the screen thanks to the calendar fields.
Note: the daily restitution graph may show abnormally high or low points, which is normal when the vehicle has “not” run, only engine ignition or a very low number of km. On the global calculation this will have no impact
Example, 1L of fuel was consumed by a vehicle the day before; it traveled 1km with an engine running period of 20min. The final report would give a projected consumption of 100L/100km which is true over this short period. Once the calculation is carried over to the week or month, this consumed L will be totally invisible and this day will have no impact.
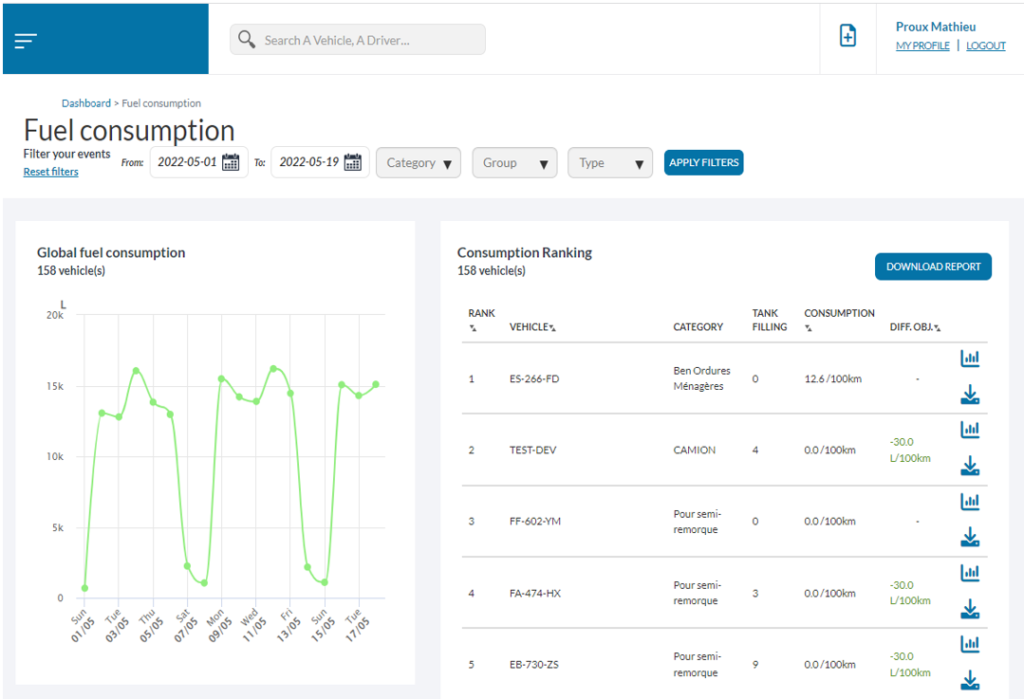
Analyze multiple vehicles
To analyze the consumption of the fleet or of a series of vehicles, go to the page[MES CONSOMMATIONS] accessible via the side menu. On this screen, it is possible to filter consumption by:
- Start date – end date
- Consumption category
- vehicle group
- Vehicle type
The screen is divided into 2 sections, on the left the summary of the cumulative daily consumption of the vehicles selected over the defined period.
On the right, the ranking of all the vehicles according to their target deviation; additional information such as the number of fillings enrich this section. On each vehicle, it is possible to download an individual consumption report

or access the statistics page for this vehicle

.