All the data reported by the vehicles is in real time, which allows certain analyzes to be carried out instantly.
Follow the evolution of a vehicle’s fuel
It is possible to display the evolution curve of the fuel levels of a vehicle from two places:
- By clicking on the vehicle name from anywhere on the platform, then displaying the fuel tab
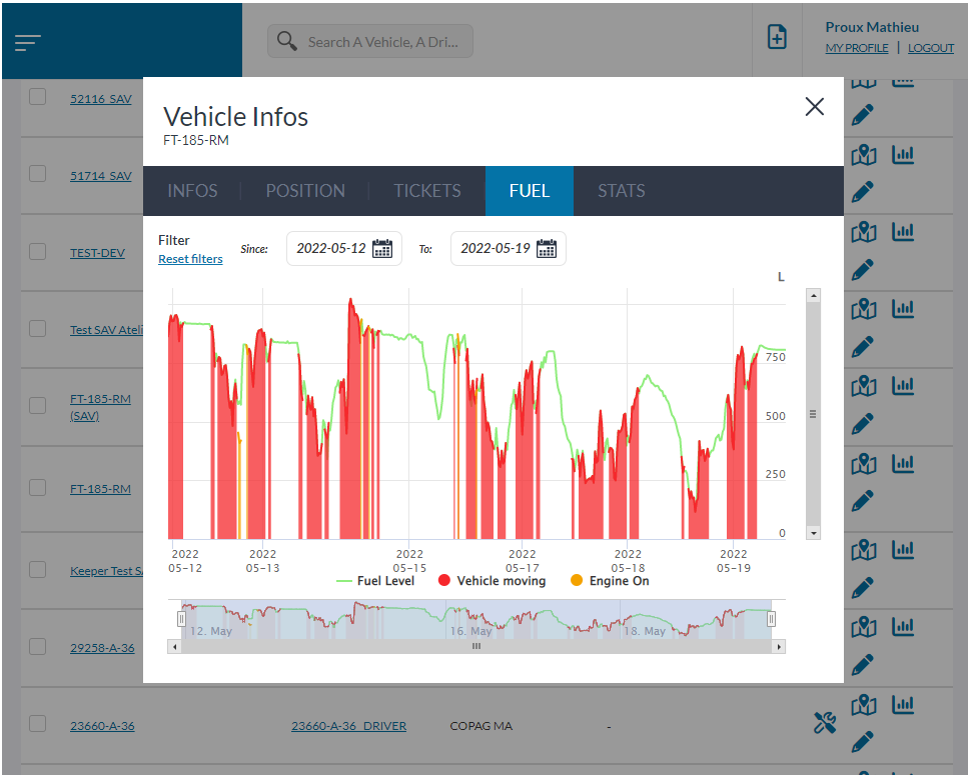
- By clicking on the “curve” icon from the individual vehicle statistics screen
The data is aggregated and represented by a point every 15min, this means that each point corresponds to the average of the events (engine state, movement, fuel).
It is possible to display/hide the various information visible on the graph, namely:
- fuel level
- engine states
- the state of the vehicle (in motion)
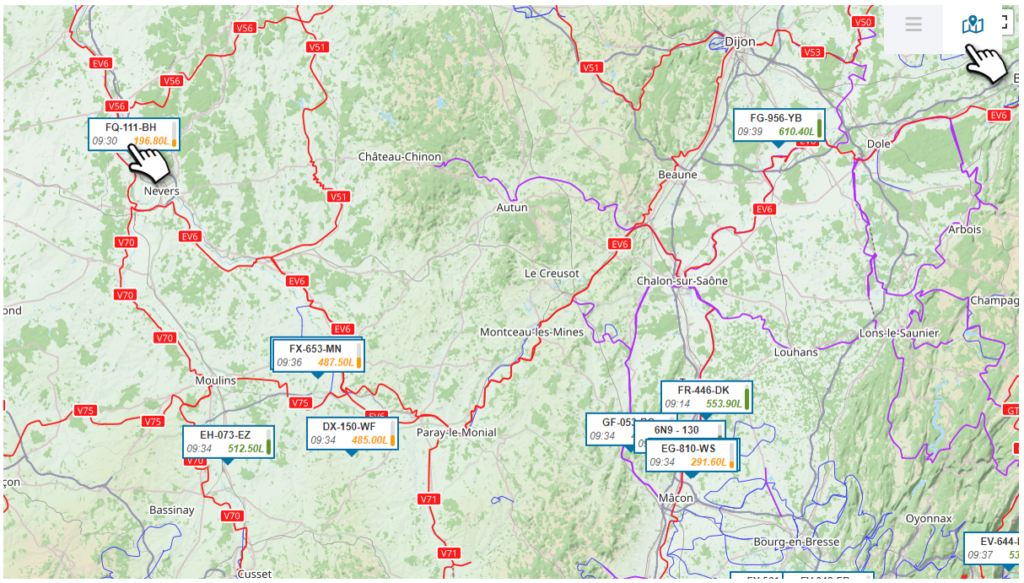
Track positions and manage filling rounds
From the map view of the list of vehicles, it is possible to identify the last positions and the last fuel levels of each of your vehicles/machines. A filter is also applicable in order to work on specific groups.
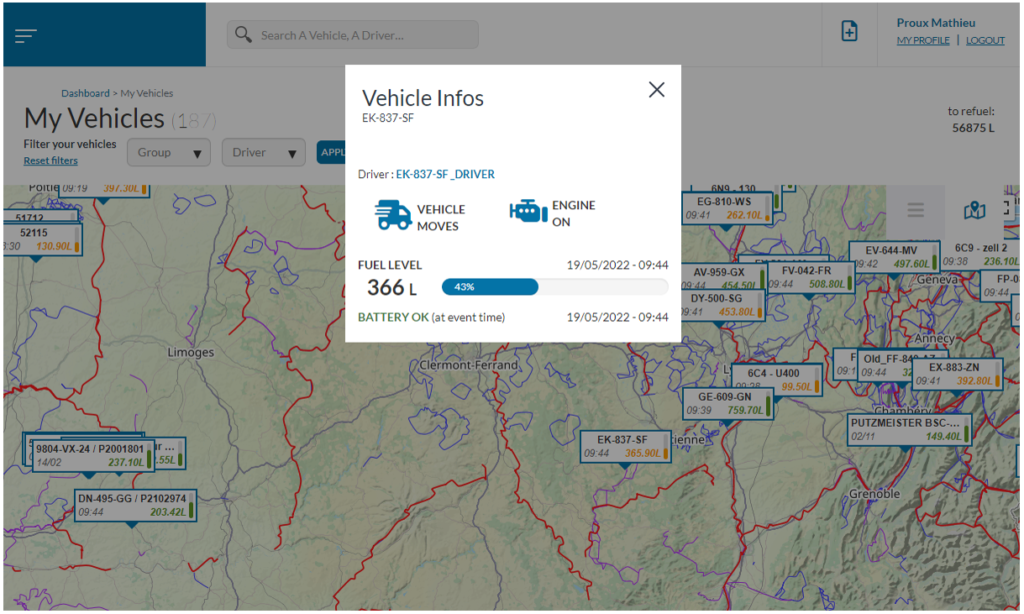
When you click on the vehicle, real-time information is displayed:
Driver name (if associated), engine status, moving vehicle, fuel level, battery status